GrapheR !!!

What a wonderful gem GrapheR is.... Oh yes it is. GrapheR is a GUI for base graphics in R by http://www.maximeherve.com/. The package provides a graphical user interface for creating base charts in R. It is ideal for beginners in R, as the user interface is very clear and the code is written along side into a text file, allowing users to recreate the charts directly in the console.
Adding and changing legends? Messing around with the plotting window settings? It is much easier/quicker with this GUI than reading the help file and trying to understand the various parameters.
Here is a little example using the iris data set.
library(GrapheR)
data(iris)
run.GrapheR()
This will bring up a window that helps me to create the chart and tweak the various parameters.
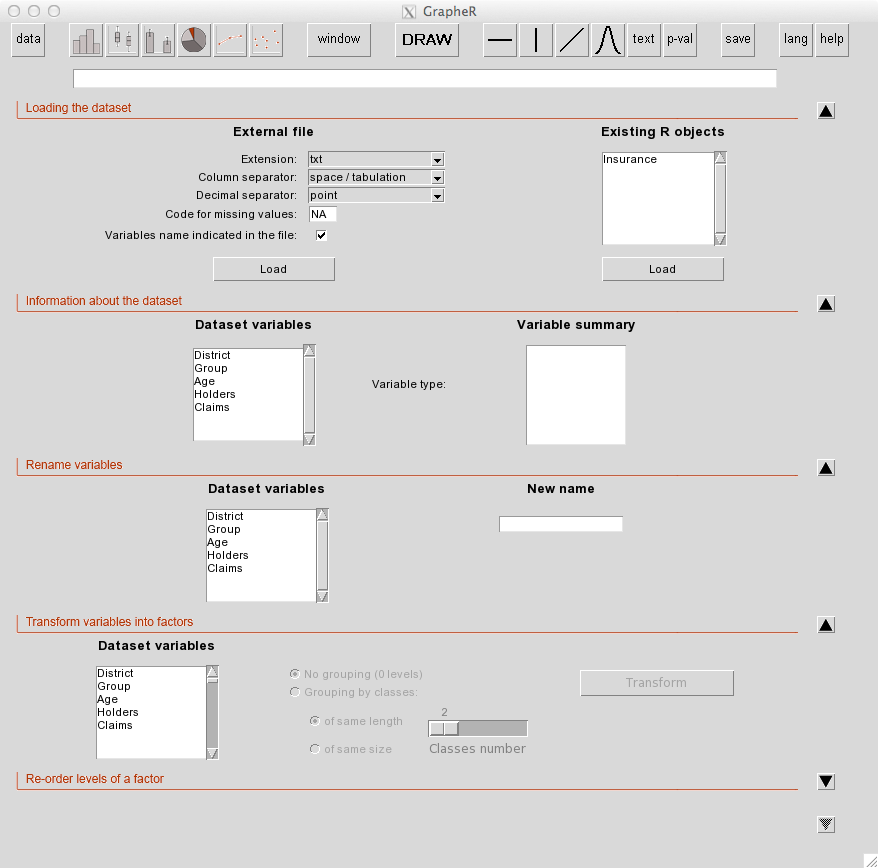
Finally, I find the underlying R code in a file created by GrapheR. For more details read also the package vignette, which is available in English, French and German!