
Monitor running jobs on Linux server

You as a bioinformatican run lots of program on your servers. Sometime the shared server is also used by your colleague. If server is busy you sometime need to check the running programs and want to monitor the running programs as well. The "top" command will come in handy when you need to find out if things are still running, how long they’ve been running, or how much memory is being used.
‘top’ is very simple to run: type
%% top
You’ll get a screen that looks like this, and is updated regularly: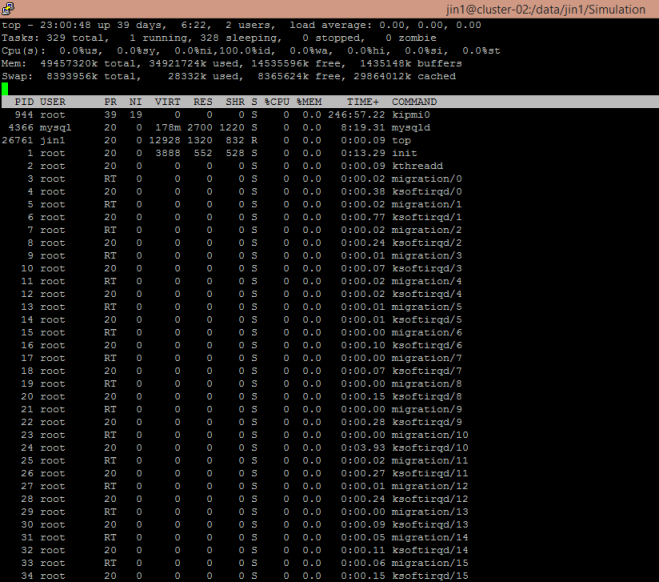
Simple, right? Heh.
First! Note that you can use ‘q’ or ‘CTRL-C’ to exit from ‘top’.
Now let’s read and understand at each line independently.
The first line:
top - 23:00:48 up 39 days, 2 user, load average: 0.00, 0.00, 0.00
The first line tells you the current time, how long the machine has been up, how many users are logged in, and the short/medium/long-term compute load on the machine. If you run something for a long time, you’ll see these numbers go up. Right now, the machine is basically just sitting there, so these are all close to 0.
The second line:
Tasks: 239 total, 1 running, 238 sleeping, 0 stopped, 0 zombie
This line tells you how many processes are running. If you are using laptops machines it’s not so interesting because you really are the only one using this machine.
Cpu(s): 0.0%us, 0.0%sy, 0.0%ni,100.0%id, 0.0%wa, 0.0%hi, 0.0%si, 0.0%st
This line contains the CPU load. The first two numbers are how busy the system is doing computation (“us” stands for “user”) and how busy the system is doing system-y things like accessing disks or network (“sy” stands for “system”). We’ll talk more about this later.
Mem: 49457320k total, 3492174k used, 14535596k free, 1435148k buffers
This should be easy to understand – how much memory you’re using!
Swap: 539356k total, 28332k used, 836562k free, 29862014k cached
Swap is just on-disk memory that can be used to “swap” out programs from main memory. Again, we’ll talk about this later.:
PID USER PR NI VIRT RES SHR S %CPU %MEM TIME+ COMMAND
1 root 39 19 0 0 0 S 0.0 0.0 246:57.22 kipmi0
2 root RT 0 0 0 0 S 0.0 0.0 0:00.00 migration/0
And... finally! What’s actually running! The two most important numbers are the %CPU and %MEM towards the right, as well as the COMMAND. This tells you how compute- and memory-intensive your program is. Right now, nothing’s running so the numbers aren’t very interesting, but just wait until we run something...