Jit
Enthusiast computational biologist with business dream !!!
Our Sponsors
auN: a new metric to measure assembly contiguity
https://lh3.github.io/2020/04/08/a-new-metric-on-assembly-contiguity
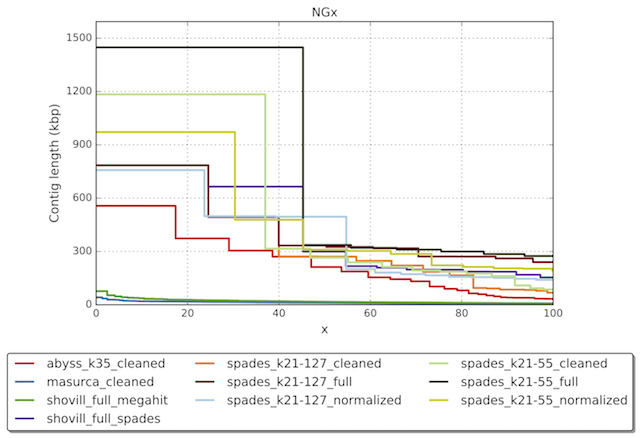
Given a de novo assembly, we often measure the “average” contig length by N50. N50 is neither the real average nor median. It is the length of the contig such that this and longer contigs cover at least 50% of the assembly. A longer N50 indicates better contiguity. We can similarly define Nx such that contigs no shorter than Nx covers x% of the assembly. The Nx curve plots Nx as a function of x, where x is ranged from 0 to 100.

Related items
- fragScaff: Genome Assembly with Contiguity Preserving Transposition
2520 days ago
Jitbookmark - Hagfish - assess an assembly through creative use of coverage plots
3244 days ago
Abhibookmark - GRAbB: Selective Assembly of Genomic Regions, a New Niche for Genomic Research
2263 days ago
Rahul Nayakbookmark - LACHESIS: Genome Assembly with Hi-C-based Contact Probability Maps (LACHESIS)
2520 days ago
Jitbookmark - GMASS: a novel measure for genomeassembly structural similarity
2185 days ago
Abhimanyu Singhbookmark - QuasiModo - Quasispecies Metric Determination on Omics
1381 days ago
Neelbookmark - Comparison of Short Read De Novo Alignment Algorithms
4247 days ago
Rahul Agarwalbookmark - coursera genome assembly tutorial
2690 days ago
Jitbookmark
